
I grew up in rural Morgan County, Alabama, about 45 minutes south from the City of Huntsville. As a kid, I remember the old-timers always complaining about how hot our Deep South summers were. I also remember watching the evening news and occasionally seeing talk about global warming, which later gave way to talk about climate change (though not often—I later learned that trade groups representing the fossil fuel industry had conspired to suppress news stories and the public’s understanding about climate change).
Now that I’m becoming an old-timer myself, and now that I live in Huntsville, I’ve wondered: was there something to all that heat-related chatter I heard when I was young? Has North Alabama really gotten hotter as I’ve aged?
I went looking for climate data that could answer the question. I found Climate Data Online (CDO), an online climate data archive and search tool from NOAA’s National Centers for Environmental Information. CDO offers historic data down to the day for weather stations across the country.
The Huntsville-area weather station with the longest and most consistent history of air temperature data was the National Weather Service’s station at the Huntsville International Airport (HSV). According to the dataset, the station began recording local climate data on September 1, 1958.
I requested this data from CDO and dove in. Here’s what I discovered.
What does the data say?
According to the data, the average temperature among all days in 1960 was 60.2°F. Below is a chart I put together that shows how far above or below the average was for each year over the next 64 years. I averaged the data by year between January 1, 1960 and December 31, 2024 to give me even four-year intervals on the x-axis.
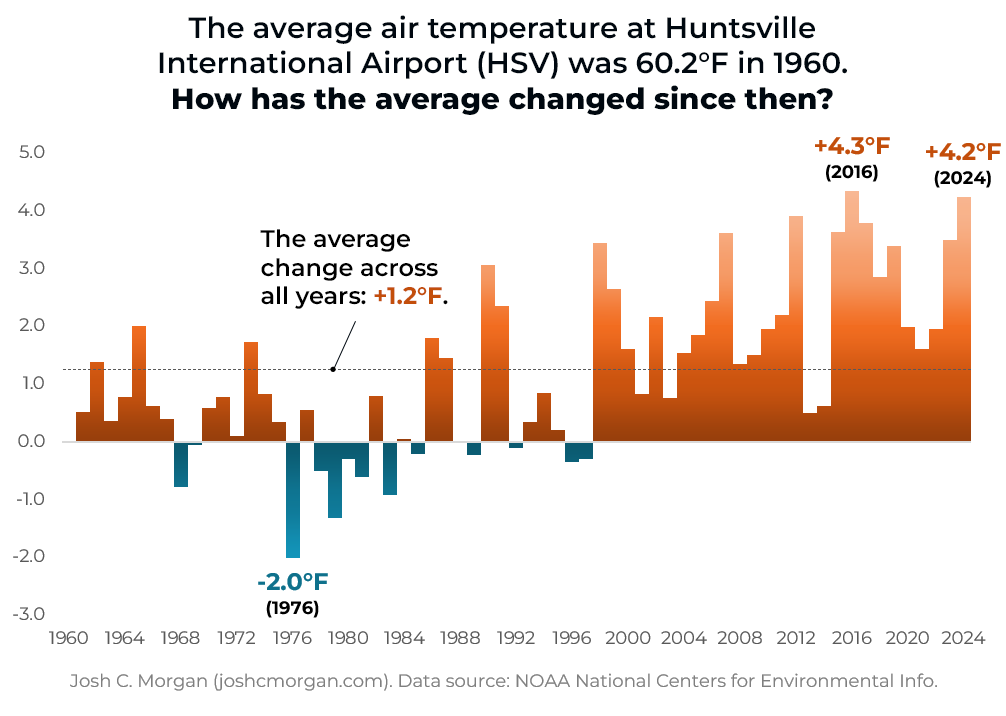
As shown above, there have been far more years with average temperatures above 60.2°F since 1960 than not. In fact, the average increase across those 64 years was 1.2°F. The largest increases also occurred in the 21st century, suggesting that the overall trend may be increasing.
Based on the results above, I think it’s fair to say the climate has gotten slightly hotter in the Huntsville area since 1960.
Methodology
I used Microsoft Excel 365 and Photopea.com to analyze HSV station data from CDO. I created a pivot table to condense the daily data into years, which I then used to calculate the average annual air temperatures. You can download the data in an .xlsx file here: HSV Climate Data – 1960-2024.
Notes about how I used the data and its limitations:
- Data exists before 1958 from other local weather stations, but it wasn’t collected as consistently as it was at HSV. Data from those older stations could have been affected by different environmental factors than were present at HSV. The HSV data, for instance, may have been impacted by an urban heat island effect, whereas the older stations were not. For those reasons, I only included the HSV data.
- I excluded data from 1958 because it was an incomplete year. I also excluded data from 1959 because, as I mentioned above, starting with 1960 gave me even four-year intervals.
- I also analyzed data on annual precipitation and snowfall from HSV via CDO. I found no significant changes there between 1960 and 2024.
- I searched for historical data on dew point readings in Huntsville to measure humidity. However, that data appears to not exist from a public source.
Also From the Author
“Trust Among Americans Isn’t Over Yet”: Only 1 in 4 Americans now agree that most people can be trusted. What has caused the decline of trust and what can be done about it?